Smart Present is an easy-to-use tool that guides non-technical users step-by-step through the process of building analytical content using augmentation engines and heuristics. This tool offers users the simplest method for building data visuals in Pyramid using a simple point-and-click wizard.
The result of running this tool is that a new presentation is created from scratch with your first one-off discovery embedded on its first slide.
Tip: If you already have a presentation, you can add a new discovery using Smart Reporting by selecting the Smart Reporting option in the Toolbox. For details, see Creating visuals using Smart Reporting in Present Pro or Creating visuals using Smart Reporting in Present Lite.
Smart Present
Opening the Smart Present wizard
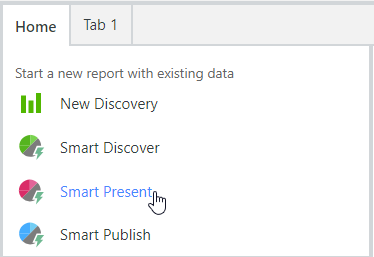
You may be able to select the Smart Present option from your Pyramid home page or from the Quick Start panel:

Note: This option will typically be available from the New Report panel of your home page, although your home page is fully configurable.
Selecting your data model
Select the data model that contains your data. You can select a model from your Recent or Favorites views or navigate through the Explorer view to your model.
For detailed steps describing this process, see Opening a data model in the Discover section of this help file.
Tip: For your data model, you can select one of the following options:
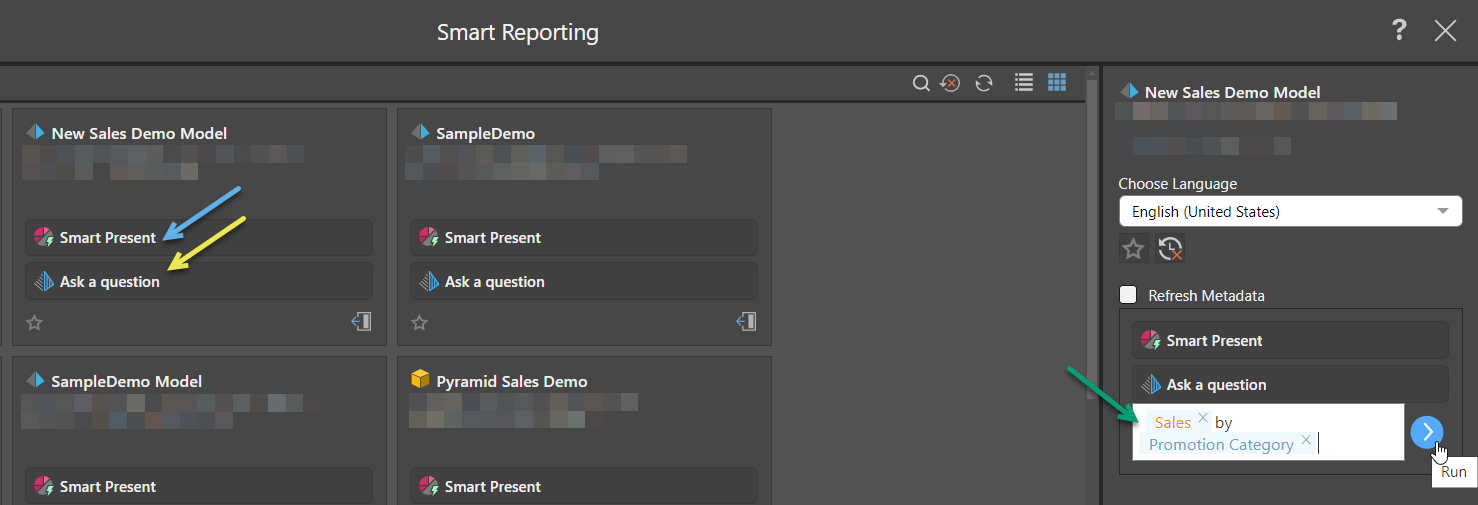
- Select Smart Present (blue arrow) to open an empty instance of Smart Reporting. You can then build your visual
- If you know what you would like to add to your visual, select Ask a Question (yellow arrow below) and describe the visual that you'd like to create using natural language (green arrow). Selecting this option opens Smart Reporting, builds an initial visual, and also opens the Chatbot.

Building or editing your visual
From the Smart Reporting window:
- If you need to add data to your visual, click Select Data + to open the data selection panel and then add measures (quantitative data), hierarchies (qualitative data), or filters to your visual. Note that each time you make a selection, a chip is added to the header above the canvas and the visual is redrawn to reflect your additional selection.
- The first time you access this panel, you can only add Values (also called Measures).
- Subsequently, you can add Values, Dimensions, or Filters.
- Click here for the help materials for Smart Reporting.
- Once you have built your visual and are happy to add it to your presentation, click Finish.
For an overview of the Smart Reporting tool, see:
Smart discoveries that have been created and saved in this way are one-off content items, existing only in the current presentation. By default, the visual is created with the name New Discovery.
Tip: To rename the new discovery, you can right-click the visual and select Show Panels on the context menu. You can then create a custom title for it in the Panel Settings.
What next?
You might want to add more content items to your slide; for example, text headers, images, descriptions, and so on. If so, you can add them just as you can in any other presentation.
- Click here to learn more about adding presentation content
You might want to save your new discovery and make it shareable; if so, you can right-click it and select Make Shareable from the context menu or App Tabs menu.
- Click here to learn more about Smart Discover